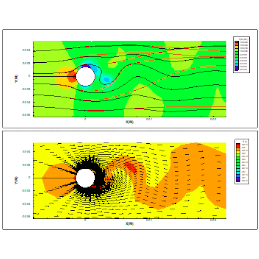
Q&A on visualizing transient data

Recordings of interactive sessions help beat inconvenient times

Tecplot can do a whole lot of things, which also means using it can and does give rise to a whole lot of questions. Time-dependent data can be a particular challenge. This recording (accompanied with a transcript) answers questions raised by different users. Email support if there’s anything you’re grappling with that isn’t available in the discussion.

Share this post

Share on facebook
Share on twitter
Share on linkedin
Newsletter

Sign up to our newsletter and get your latest posts emailed to you.

Search
Category
Categories
Archives
Archives
Follow Us
Weekly Tutorial

KFour Metrics offers technology solutions for engineering design, simulation and optimization.

Email

info@kfourmetrics.com

Phone

+91 93900 04190​

Address

Avanti, Road No.12, Banjara Hills,
Hyderabad 500 034, India.

Newsletter

Sign up to our newsletter

Newsletter

Sign up to our newsletter and get your latest posts emailed to you.

Search
Category
Categories
Archives
Archives
Follow Us
Weekly Tutorial