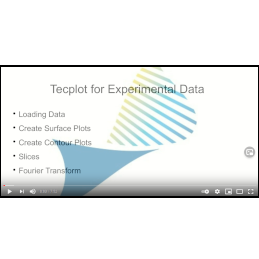
For all the criticism leveled at Infographics and other tools that reduce text to images, there are numerous situations where the graphic form is invaluable. View this 7 minute video for an outline on how you can visualize and analyze tabular data using Tecplot. Stuck with a stubborn set of data? Reach out for support!


