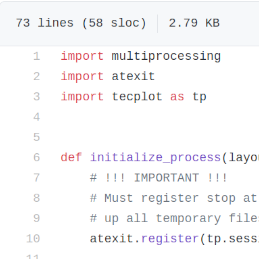
If the proof of the pudding is in the eating, creating reports for CFD analyses can be inelegant gluttony. Generating images is resource-intensive and error-prone. Why not use Tecplot’s Python API to simplify this? As described in this article, this script opens a layout and generates a series of images at different time steps – and in parallel! You say Gourmand, I say Gourmet?


