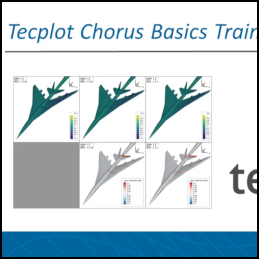
DOE is not the only reason an analyst is tasked with extracting meaningful data from a large number of solution sets. What if you’ve run a grid-dependence study and need to figure out which regions of the domain were most affected? It can feel like looking for gold on a sandy beach, but doesn’t have to.
Chorus, a part of your Tecplot installation, is designed specifically for such scenarios. This hour-long video is well worth the time. Scatter plots, Surrogate Models, Deep-dives: three out of three ain’t bad.


