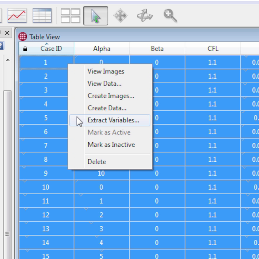
Chorus is designed to help discern trends in large sets of data: scatter plots and line plots make tabular data much easier to interpret. But what if you wish to examine a derived variable such as an integral of a solution variable? Read this article – and watch the accompanying video – to see how you can marry Tecplot Macros with Chorus to easily create and extract such variables from a large number of CFD-analyses.


