Visual Consistency

"plenty of ways graphs can mislead and outright manipulate"

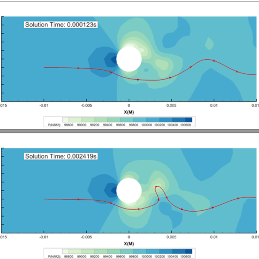
When they’re used well, as this article points out graphs can help us intuitively grasp complex data. It goes on to list – and illustrate – several examples of the counterfactual. The impact can be that much worse, of course, if comparisons between datasets aren’t presented well. See this article for the ways you can avoid such errors using Tecplot.

Share this post

Share on facebook
Share on twitter
Share on linkedin
Newsletter

Sign up to our newsletter and get your latest posts emailed to you.

Search
Category
Categories
Archives
Archives
Follow Us
Weekly Tutorial

KFour Metrics offers technology solutions for engineering design, simulation and optimization.

Email

info@kfourmetrics.com

Phone

+91 93900 04190​

Address

Avanti, Road No.12, Banjara Hills,
Hyderabad 500 034, India.

Newsletter

Sign up to our newsletter

Newsletter

Sign up to our newsletter and get your latest posts emailed to you.

Search
Category
Categories
Archives
Archives
Follow Us
Weekly Tutorial