Triangulation to visualize “unorganized” data

"By customer request, triangulation is again available"

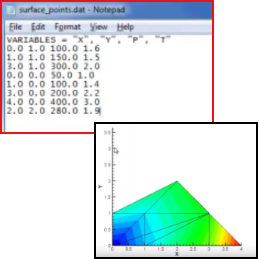
Not all CFD data comes from a grid: you could have data that’s just a collection of values at specified coordinates. Tecplot considers this data “unorganized”, but that doesn’t mean you can’t visualize it. See this video for on outline on how to triangulate such data. Controlling the triangulation can be useful: see this article for ways to determine which data points Tecplot takes into account.

Share this post

Share on facebook
Share on twitter
Share on linkedin
Newsletter

Sign up to our newsletter and get your latest posts emailed to you.

Search
Category
Categories
Archives
Archives
Follow Us
Weekly Tutorial

KFour Metrics offers technology solutions for engineering design, simulation and optimization.

Email

info@kfourmetrics.com

Phone

+91 93900 04190​

Address

Avanti, Road No.12, Banjara Hills,
Hyderabad 500 034, India.

Newsletter

Sign up to our newsletter

Newsletter

Sign up to our newsletter and get your latest posts emailed to you.

Search
Category
Categories
Archives
Archives
Follow Us
Weekly Tutorial