How to create histograms using Tecplot

"[O]ne of the seven basic tools of quality control"

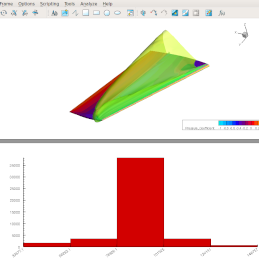
Tecplot’s handy scripts provide lots of utility functions, one of which is today’s highlight. Histograms are are not often used for CFD postprocessing but not all data that Tecplot’s used for comes from CFD. Even for CFD, histograms can provide useful insights into behavior. Start Tecplot and load your data, turn on Python connections, then run this script to get plots like the one shown here. Remember to specify the name of the variable and the number of bins on the command-line! Let us know if you need help.

Share this post

Share on facebook
Share on twitter
Share on linkedin
Newsletter

Sign up to our newsletter and get your latest posts emailed to you.

Search
Category
Categories
Archives
Archives
Follow Us
Weekly Tutorial

KFour Metrics offers technology solutions for engineering design, simulation and optimization.

Email

info@kfourmetrics.com

Phone

+91 93900 04190​

Address

Avanti, Road No.12, Banjara Hills,
Hyderabad 500 034, India.

Newsletter

Sign up to our newsletter

Newsletter

Sign up to our newsletter and get your latest posts emailed to you.

Search
Category
Categories
Archives
Archives
Follow Us
Weekly Tutorial