Visual Communication

"when it comes time to communicate your results"

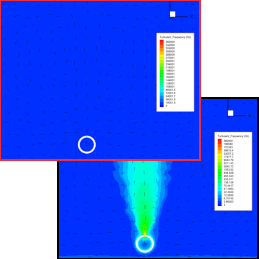
Pretty worthless, right?” is just the question to grab your attention when it comes to critiquing and selecting from the various options available for communicating data visually. It’s all OK to say a picture’s worth a thousand words, but what if you’re stuck choosing between thousands of options? Read this article for some basics on contour plots, XY-line plots and the appropriate zoom level.

Share this post

Share on facebook
Share on twitter
Share on linkedin
Newsletter

Sign up to our newsletter and get your latest posts emailed to you.

Search
Category
Categories
Archives
Archives
Follow Us
Weekly Tutorial

KFour Metrics offers technology solutions for engineering design, simulation and optimization.

Email

info@kfourmetrics.com

Phone

+91 93900 04190​

Address

Avanti, Road No.12, Banjara Hills,
Hyderabad 500 034, India.

Newsletter

Sign up to our newsletter

Newsletter

Sign up to our newsletter and get your latest posts emailed to you.

Search
Category
Categories
Archives
Archives
Follow Us
Weekly Tutorial